Market Outlook
July19, 2017
Market Cues
Domestic Indices
Chg (%)
(Pts)
(Close)
Indian markets are likely to open in green and may remain flat tracking SGX Nifty
BSE Sensex
(1.1)
(364)
31,711
and Asian indices.
Nifty
(0.9)
(89)
9,827
After ending the previous session roughly flat, US stocks market continued to turn in
Mid Cap
(0.6)
(91)
15,107
a lackluster performance during trading on Tuesday. The choppy trading on Wall
Small Cap
(0.6)
(92)
15,818
Street came as traders expressed uncertainty about the near-term outlook for the
Bankex
(0.0)
(12)
27,203
markets after the Dow and S&P 500 reached record highs.
The European markets ended Tuesdays session firmly in negative territory. Mixed
Global Indices
Chg (%)
(Pts)
(Close)
corporate earnings results weighed on investor sentiment, as well as the
strengthening of the Euro.
Dow Jones
(0.3)
(55)
21,575
Nasdaq
0.5
30
6,344
Indian share market tumbled on Tuesday amid heavy selling in consumer stable
stocks after the GST council increased compensation cess on cigarettes.
FTSE
(0.2)
(14)
7,390
Nikkei
(0.6)
(119)
20,000
Hang Seng
0.2
254
26,525
News Analysis
Shanghai Com
0.3
11
3,188
UltraTech to set 3.5 mn tonne plant in Madhya Pradesh for `2,600Cr
Detailed analysis is on Pg2
Advances / Declines
BSE
NSE
Investor’s Ready Reckoner
Advances
1,978
1,601
Key Domestic & Global Indicators
Declines
1,734
1,106
Unchanged
138
69
Stock Watch: Latest investment recommendations on 150+ stocks
Refer Pg6 onwards
Volumes (` Cr)
Top Picks
BSE
3,854
CMP
Target
Upside
Company
Sector
Rating
(`)
(`)
(%)
NSE
28,777
Blue Star
Capital Goods
Buy
652
760
16.5
Dewan Housing FinanceFinancials
Buy
459
520
13.2
#Net Inflows (` Cr)
Net
Mtd
Ytd
Mahindra Lifespace
Real Estate
Buy
436
522
19.6
Navkar Corporation
Others
Buy
201
265
31.8
FII
(56376
(2,2(46)
55,863
KEI Industries
Capital Goods
Accumulate
234
258
10.0
MFs
8163
4,608
43,754
More Top Picks on Pg3
Key Upcoming Events
Top Gainers
Price (`)
Chg (%)
Previous
Consensus
Date
Region
Event Description
Hcl-Insys
156
18.7
Reading
Expectations
Jul 19, 2017
US
Housing Starts
1,092.00
1,160.00
Fconsumer
41
7.9
Jul19, 2017
US
Initial Jobless claims
247.00
245.00
Infibeam
1,186
5.4
Jul 20, 2017
US
Building permits
1,168.00
1,200.00
Sintex
33
4.4
Jul 20, 2017
Euro Zone Euro-Zone Consumer Confidence
(1.30)
(1.20)
Jublfood
1,326
4.1
Jul 20, 2017
Germany PMI Manufacturing
59.60
More Events on Pg4
Top Losers
Price (`)
Chg (%)
Itc
285
(12.6)
Network18
52
(9.1)
Tv18Brdcst
39
(6.2)
Godfryphlp
1,158
(5.7)
Kpit
130
(4.9)
#as on 18t July, 2017
Market Outlook
July19, 2017
News Analysis
UltraTech to set 3.5 mn tonne plant in Madhya Pradesh for `2,600Cr
Markets leader UltraTech Cement on Tuesday announced a
`2,600Cr new
integrated cement plant in Madhya Pradesh with a capacity of 3.5 million tonne
per annum, which will increase its capacity to 96.5 mt by FY19.
This will further enhance UltraTech's presence in Central India furthermore
company has also commissioned cement grinding units in Nagpur in Maharashtra
and at Patliputra in Bihar during the year gone-by. The acquisition of the cement
business of Jaypee Group (Jaiprakash Associates and Jaypee Cement
Corporation) and those in the overseas operations in the UAE will propel
UltraTech's capacity to 96.5 mt
Company also has an additional capex plan of about `2,200Cr for the current
fiscal, which will mainly be utilised for capacity de-bottlenecking projects,
regulatory requirements, plant infrastructure and routine maintenance. The
company has in-principal approval to rise `9,000Cr debt but has no plans to raise
equity, offer rights issue or splitting the share value as the company has a very
strong balance sheet and robust cash flows
Economic and Political News
Cabinet may decide on HPCL 51% stake sale to ONGC tomorrow
5-star hotels with tariff under `7,500 to attract 18% GST
250,000 gram panchayats to be digitally connected by mid-2018: Prasad
Chhattisgarh completes kharif sowing in 60% of targeted acreage
7th Pay Commission: Govt extends deadline to receive, dispose of anomalies
Corporate News
Crisil Q2 net profit up 9.3% at `67.25Cr
Bata India eyes 35% revenue contribution from women's footwear
Sundaram Finance June qtr net up 30% to `117Cr, revenue rises 11%
AI's net loss narrows to `3,643Cr; operating up rises in 2016-17
Apollo Hospitals to add over 2,000 beds in next three-year expansion plan
Market Outlook
July19, 2017
Top Picks HHHHH
Market Cap
CMP
Target
Upside
Company
Rationale
(` Cr)
(`)
(`)
(%)
Strong growth in domestic business due to its leadership
in acute therapeutic segment. Alkem expects to launch
Alkem Laboratories
20,756
1,736
2,161
24.5
more products in USA, which bodes for its international
business.
We expect the company would report strong profitability
Asian Granito
1,269
422
480
13.8
owing to better product mix, higher B2C sales and
amalgamation synergy.
Favourable outlook for the AC industry to augur well for
Cooling products business which is out pacing the
Blue Star
6,246
652
760
16.5
market growth. EMPPAC division's profitability to improve
once operating environment turns around.
With a focus on the low and medium income (LMI)
consumer segment, the company has increased its
Dewan Housing Finance
14,401
459
520
13.2
presence in tier-II & III cities where the growth
opportunity is immense.
Loan growth is likely to pick up after a sluggish FY17.
Karur Vysya Bank
8,119
134
160
19.1
Lower credit cost will help in strong bottomline growth.
Increasing share of CASA will help in NIM improvement.
High order book execution in EPC segment, rising B2C
KEI Industries
1,824
234
258
10.0
sales and higher exports to boost the revenues and
profitability
Speedier execution and speedier sales, strong revenue
Mahindra Lifespace
2,239
436
522
19.6
visibilty in short-to-long run, attractive valuations
Massive capacity expansion along with rail advantage at
Navkar Corporation
2,868
201
265
31.8
ICD as well CFS augurs well for the company
Strong brands and distribution network would boost
Siyaram Silk Mills
2,310
2,464
2,500
3.0
growth going ahead. Stock currently trades at an
inexpensive valuation.
Market leadership in Hindi news genre and no.
2
viewership ranking in English news genre, exit from the
TV Today Network
1,508
253
344
36.0
radio business, and anticipated growth in ad spends by
corporates to benefit the stock.
After GST, the company is expected to see higher
volumes along with improving product mix. The Gujarat
Maruti
2,28,235
7,555
8,495
12.4
plant will also enable higher operating leverage which
will be margin accretive.
Source: Company, Angel Research,
Market Outlook
July19, 2017
Quarterly Bloomberg Brokers Consensus Estimate
Havells - July 19, 2017
Particulars ( ` cr)
1QFY18E
1QFY17
y-o-y (%)
4QFY17
q-o-q (%)
Net sales
2,011
1466
37.2
1,710
17.6
EBITDA
237
201
17.9
153
54.9
EBITDA margin (%)
11.7
13.7
8.9
Net profit
171
146
17.1
95
80.0
Canara Bank - July 19, 2017
Particulars ( ` cr)
1QFY18E
1QFY17
y-o-y (%)
4QFY17
q-o-q (%)
Net profit
383
229
67.5
214
79.0
Bajaj Finance - July 19, 2017
Particulars ( Rs cr)
1QFY18E
1QFY17
y-o-y (%)
4QFY17
q-o-q (%)
Net profit
551
424
29.95
449
22.7
Reliance Industries - July 20, 2017
Particulars ( ` cr)
1QFY18E
1QFY17
y-o-y (%)
4QFY17
q-o-q (%)
Net sales
61,526
53,496
15.0
67,146
(8.4)
EBITDA
11,230
10,817
3.8
11,280
(0.4)
EBITDA margin (%)
18.3
20.2
16.8
Net profit
8,075
7,548
7.0
8,151
(0.9)
Market Outlook
July 19, 2017
Key Upcoming Events
Global economic events release calendar
Bloomberg Data
Date
Time
Country
Event Description
Unit
Period
Last Reported
Estimated
Jul 19, 2017
6:00 PMUS
Housing Starts
Thousands
Jun
1,092.00
1,160.00
6:00 PMUS
Initial Jobless claims
Thousands
Jul 15
247.00
245.00
Jul 20, 2017
6:00 PMUS
Building permits
Thousands
Jun
1,168.00
1,200.00
7:30 PMEuro Zone
Euro-Zone Consumer Confidence
Value
Jul A
(1.30)
(1.20)
1:00 PMGermany
PMI Manufacturing
Value
Jul P
59.60
Jul 24, 2017
5:15 PMEuro Zone
ECB announces interest rates
%
Jul 20
-
-
1:00 PMGermany
PMI Services
Value
Jul P
54.00
7:30 PMUS
Existing home sales
Million
Jun
5.62
5.57
Jul 25, 2017
7:30 PMUS
Consumer Confidence
S.A./ 1985=100
Jul
118.90
116.00
Jul 26, 2017
2:00 PMUK
GDP (YoY)
% Change
2Q A
2.00
7:30 PMUS
New home sales
Thousands
Jun
610.00
615.50
11:30 PMUS
FOMC rate decision
%
Jul 26
1.25
1.25
Jul 28, 2017
6:00 PMUS
GDP Qoq (Annualised)
% Change
2Q A
1.40
2.60
Jul 31, 2017
6:30 AMChina
PMI Manufacturing
Value
Jul
51.70
Aug 01, 2017
1:25 PMGermany
Unemployment change (000's)
Thousands
Jul
7.00
2:00 PMUK
PMI Manufacturing
Value
Jul
54.30
2:30 PMIndia
RBI Reverse Repo rate
%
Aug 2
6.00
Aug 02, 2017
2:30 PMEuro Zone
Euro-Zone GDP s.a. (QoQ)
% Change
2Q A
0.60
2:30 PMIndia
RBI Repo rate
%
Aug 2
6.25
2:30 PMIndia
RBI Cash Reserve ratio
%
Aug 2
4.00
Aug 03, 2017
4:30 PMUK
BOE Announces rates
% Ratio
Aug 3
0.25
0.25
Source: Bloomberg, Angel Research
Market Outlook
July 19, 2017
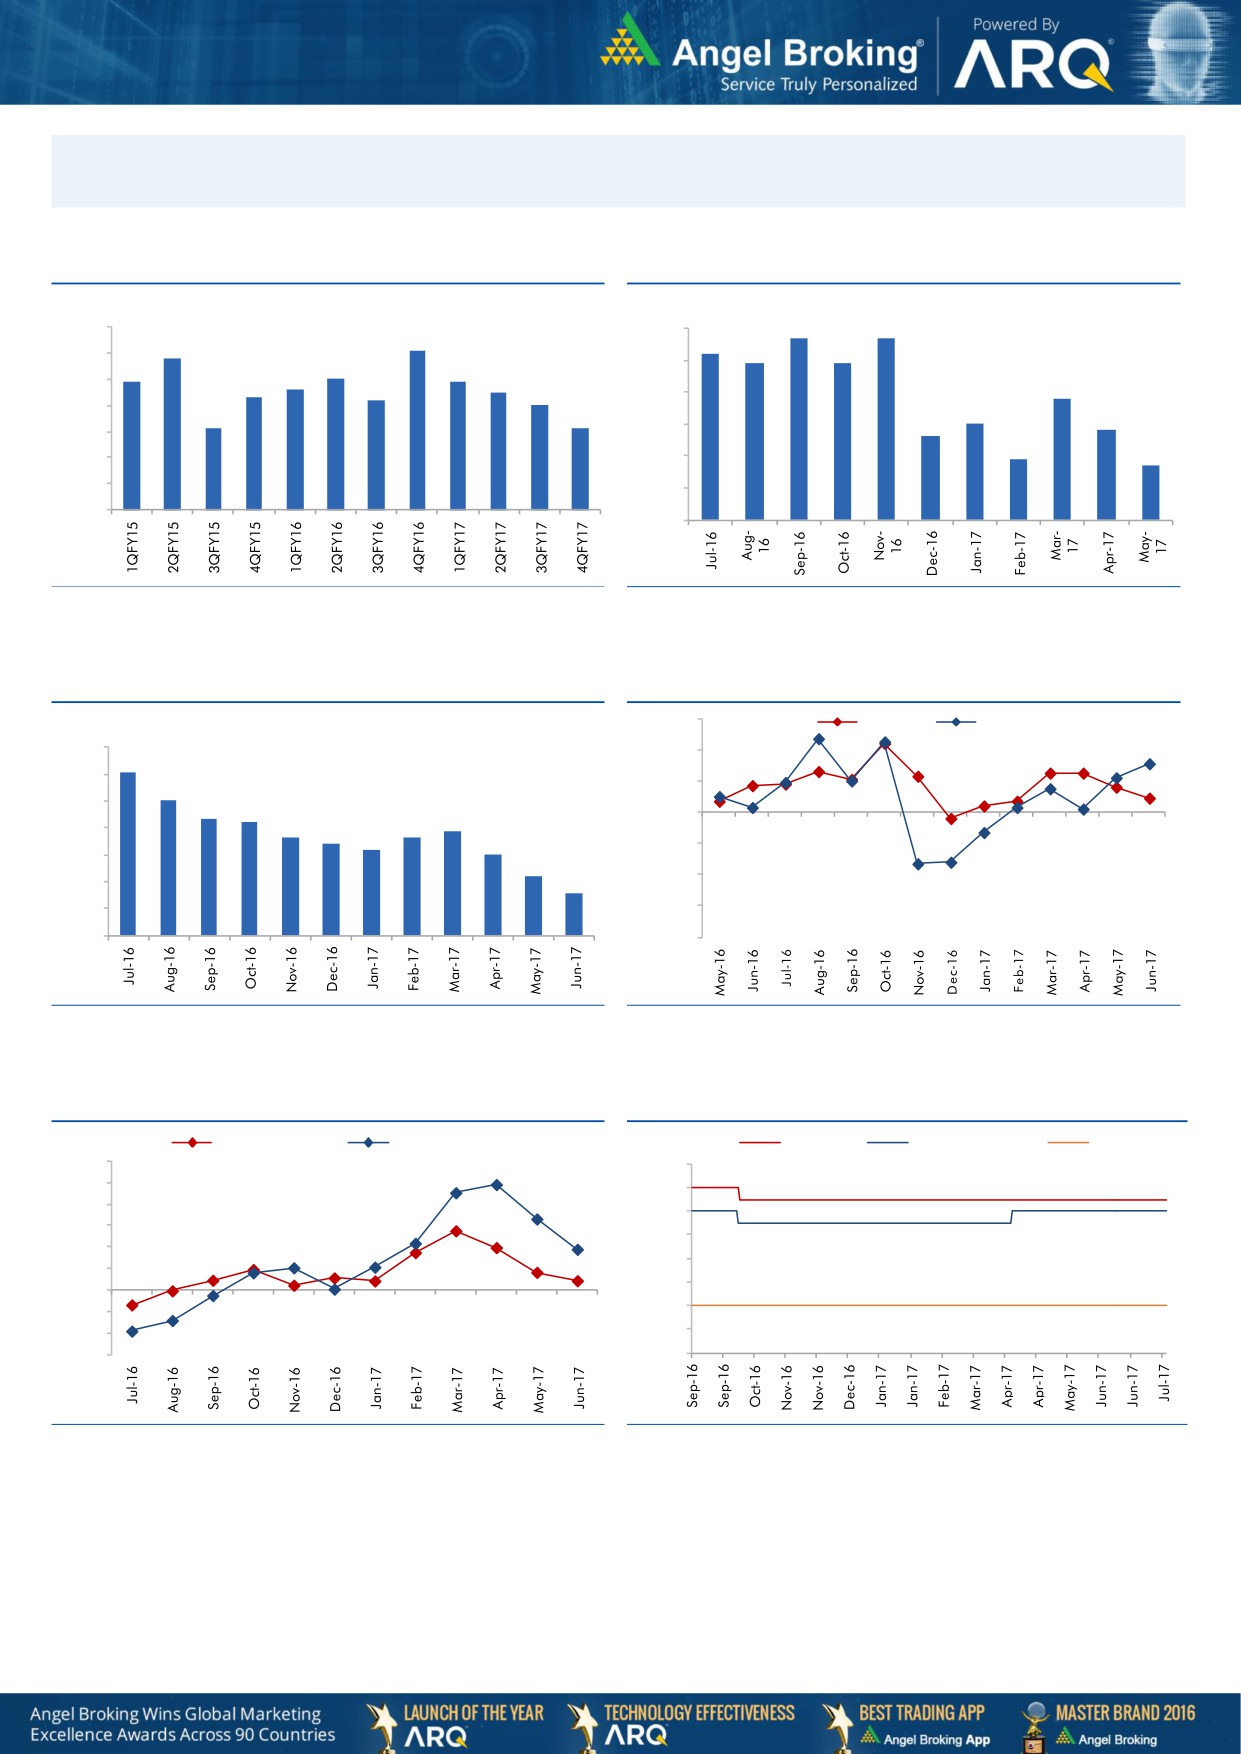
Macro watch
Exhibit 1: Quarterly GDP trends
Exhibit 2: IIP trends
(%)
(%)
5.7
5.7
10.0
6.0
9.1
5.2
8.8
4.9
4.9
9.0
7.9
8.0
7.9
5.0
7.6
7.5
8.0
7.3
7.2
3.8
7.0
4.0
7.0
3.0
6.1
6.1
2.8
2.6
3.0
6.0
1.9
1.7
5.0
2.0
4.0
1.0
3.0
-
Source: CSO, Angel Research
Source: MOSPI, Angel Research
Exhibit 3: Monthly CPI inflation trends
Exhibit 4: Manufacturing and services PMI
56.0
Mfg. PMI
Services PMI
(%)
7.0
54.0
6.1
6.0
5.1
52.0
5.0
4.3
4.2
3.9
50.0
3.6
3.7
4.0
3.4
3.2
3.0
48.0
3.0
2.2
1.5
46.0
2.0
1.0
44.0
-
42.0
Source: MOSPI, Angel Research
Source: Market, Angel Research; Note: Level above 50 indicates expansion
Exhibit 5: Exports and imports growth trends
Exhibit 6: Key policy rates
(%)
Exports yoy growth
Imports yoy growth
(%)
Repo rate
Reverse Repo rate
CRR
60.0
7.00
50.0
6.50
40.0
6.00
30.0
5.50
20.0
5.00
10.0
4.50
0.0
4.00
(10.0)
(20.0)
3.50
(30.0)
3.00
Source: Bloomberg, Angel Research
Source: RBI, Angel Research
Market Outlook
July 19, 2017
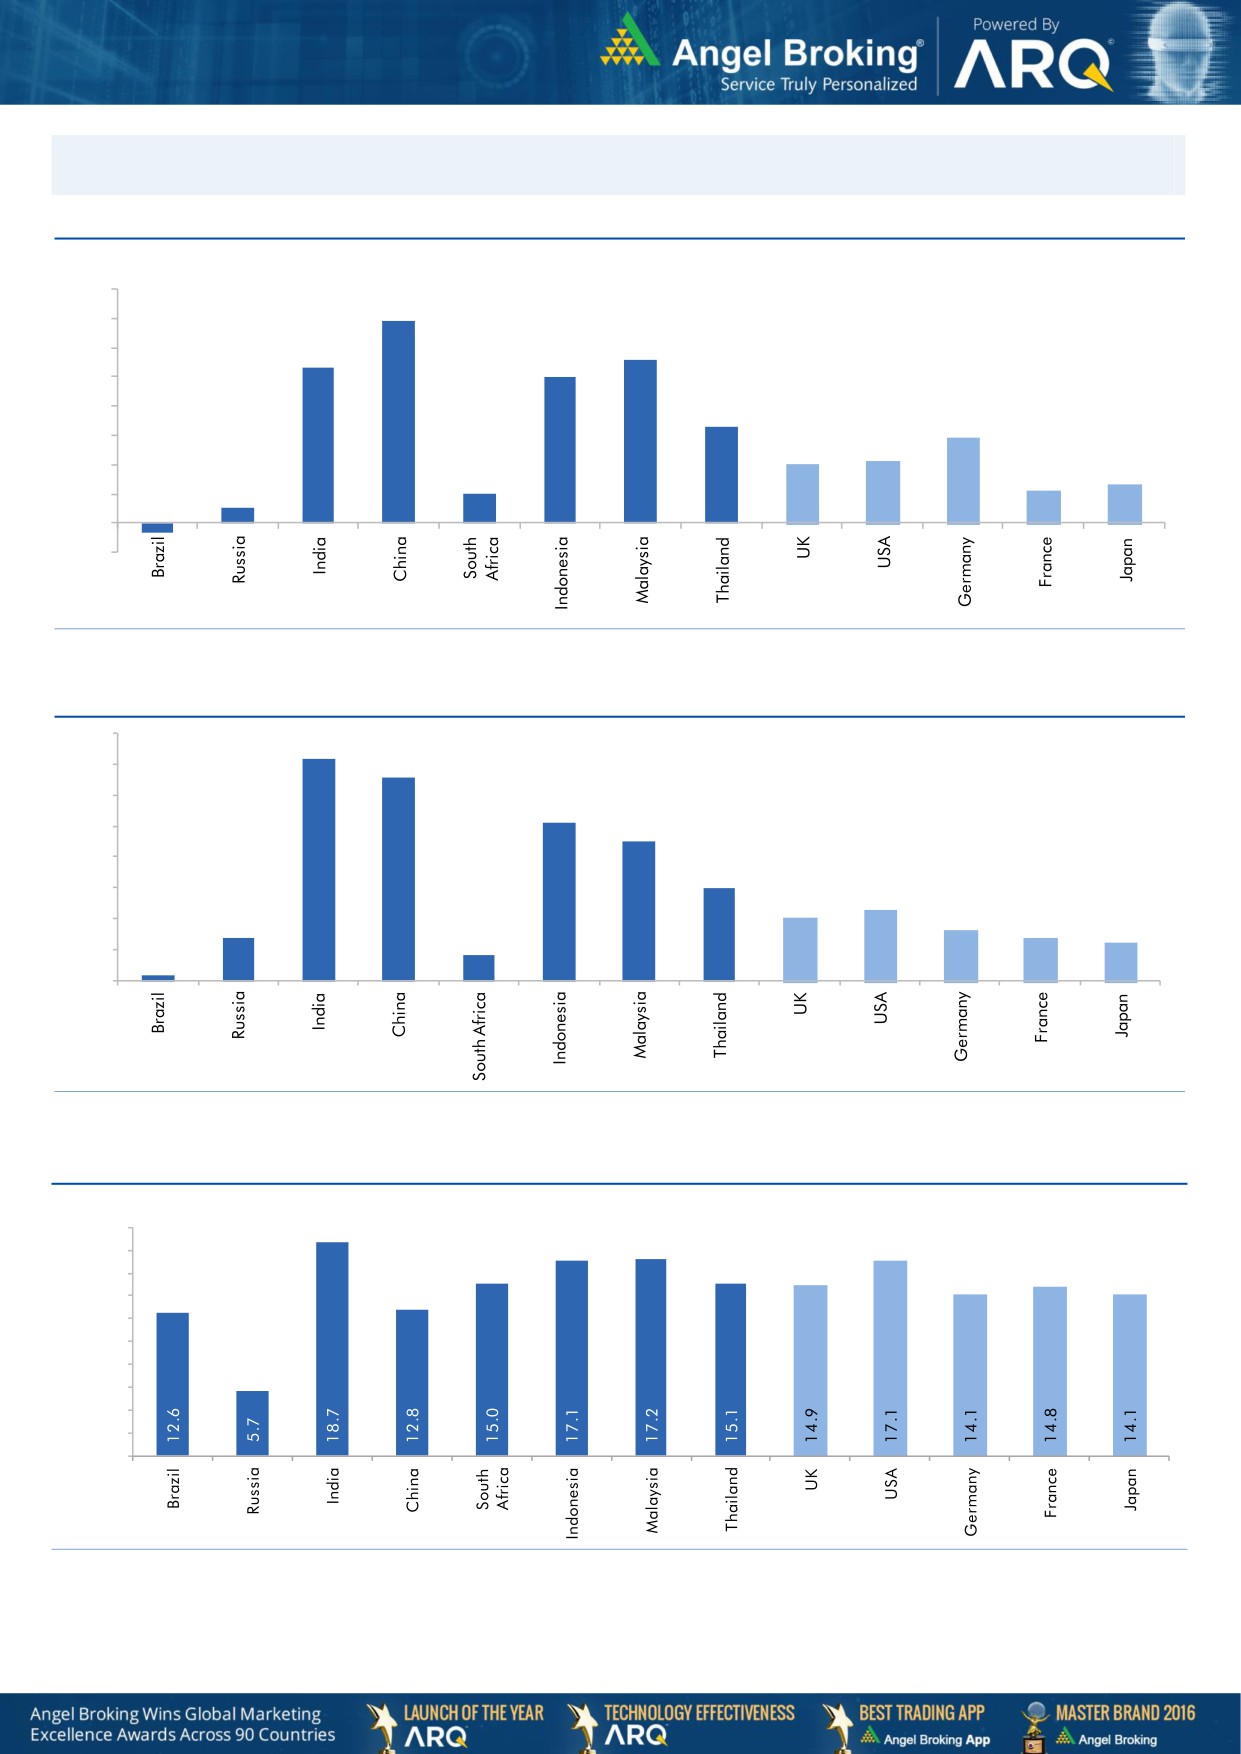
Global watch
Exhibit 1: Latest quarterly GDP Growth (%, yoy) across select developing and developed countries
(%)
8.0
6.9
7.0
5.6
6.0
5.3
5.0
1.0
5.0
4.0
3.3
2.9
3.0
2.0
2.1
2.0
0.5
1.1
1.3
1.0
-
(1.0)
(0.4)
Source: Bloomberg, Angel Research
Exhibit 2: 2016 GDP Growth projection by IMF (%, yoy) across select developing and developed countries
(%)
7.2
6.6
7.0
6.0
5.1
5.0
4.5
4.0
3.0
3.0
2.3
2.0
1.4
1.6
2.0
1.4
1.2
0.2
0.8
1.0
-
Source: IMF, Angel Research
Exhibit 3: One year forward P-E ratio across select developing and developed countries
(x)
20.0
18.0
16.0
14.0
12.0
10.0
8.0
6.0
4.0
2.0
-
Source: IMF, Angel Research
Market Outlook
July 19, 2017
Exhibit 4: Relative performance of indices across globe
Returns (%)
Country
Name of index
Closing price
1M
3M
1YR
Brazil
Bovespa
65,338
6.0
4.0
17.8
Russia
Micex
1,948
6.8
0.2
1.7
India
Nifty
9,827
2.6
7.5
15.3
China
Shanghai Composite
3,188
1.7
(0.7)
6.0
South Africa
Top 40
46,928
5.4
0.4
1.4
Mexico
Mexbol
51,100
3.8
4.8
8.6
Indonesia
LQ45
976
2.5
4.7
16.9
Malaysia
KLCI
1,755
(2.1)
0.6
6.1
Thailand
SET 50
996
0.7
(1.3)
7.6
USA
Dow Jones
21,575
1.0
4.5
16.2
UK
FTSE
7,390
(1.0)
0.9
9.8
Japan
Nikkei
20,000
0.8
8.5
32.4
Germany
DAX
12,430
(2.5)
2.7
22.5
France
CAC
5,173
(1.7)
3.7
17.7
Source: Bloomberg, Angel Research, #Data as on 18th July
Stock Watch
July 19, 2017
Company Name
Reco
CMP
Target
Mkt Cap
Sales ( Čcr )
OPM(%)
EPS (Č)
PER(x)
P/BV(x)
RoE(%)
EV/Sales(x)
(Č)
Price ( Č)
( Č cr )
FY17E FY18E
FY17E
FY18E
FY17E
FY18E
FY17E
FY18E
FY17E
FY18E
FY17E
FY18E
FY17E
FY18E
Agri / Agri Chemical
Rallis
Reduce
240
209
4,659
1,937
2,164
13.3
14.3
9.0
11.0
26.6
21.8
4.6
4.1
18.4
19.8
2.5
2.2
United Phosphorus
Neutral
857
-
43,518
15,176
17,604
18.5
18.5
37.4
44.6
22.9
19.2
4.5
3.7
21.4
21.2
3.0
2.5
Auto & Auto Ancillary
Ashok Leyland
Accumulate
106
116
30,904
20,019
22,789
11.1
11.7
4.3
5.5
24.6
19.3
4.8
4.3
19.4
22.0
1.5
1.3
Bajaj Auto
Neutral
2,824
-
81,719
25,093
27,891
19.5
19.2
143.9
162.5
19.6
17.4
5.5
4.7
30.3
29.4
3.0
2.6
Bharat Forge
Neutral
1,143
-
26,608
7,726
8,713
20.5
21.2
35.3
42.7
32.4
26.8
6.0
5.4
18.9
20.1
3.5
3.1
Eicher Motors
Neutral
28,599
-
77,851
16,583
20,447
17.5
18.0
598.0
745.2
47.8
38.4
16.3
12.4
41.2
38.3
4.5
3.6
Gabriel India
Neutral
148
-
2,128
1,544
1,715
9.0
9.3
5.4
6.3
27.4
23.5
5.2
4.6
18.9
19.5
1.3
1.2
Hero Motocorp
Neutral
3,786
-
75,595
28,120
30,753
15.2
15.6
169.1
189.2
22.4
20.0
7.7
6.5
30.8
28.2
2.5
2.3
Jamna Auto Industries Neutral
255
-
2,035
1,486
1,620
9.8
9.9
15.0
17.2
17.0
14.9
3.7
3.2
21.8
21.3
1.4
1.3
L G Balakrishnan & Bros Neutral
787
-
1,235
1,302
1,432
11.6
11.9
43.7
53.0
18.0
14.9
2.5
2.3
13.8
14.2
1.0
0.9
Mahindra and Mahindra Neutral
1,380
-
85,739
46,534
53,077
11.6
11.7
67.3
78.1
20.5
17.7
3.3
2.9
15.4
15.8
1.8
1.6
Maruti
Accumulate
7,555
8,495
228,235
67,822
83,717
15.2
15.0
243.0
291.5
31.1
25.9
7.1
5.8
22.9
22.4
3.0
2.4
Minda Industries
Neutral
668
-
5,772
2,728
3,042
9.0
9.1
68.2
86.2
9.8
7.8
2.2
1.8
23.8
24.3
2.2
1.9
Motherson Sumi
Neutral
317
-
66,797
45,896
53,687
7.8
8.3
13.0
16.1
24.3
19.7
7.8
6.3
34.7
35.4
1.5
1.3
Rane Brake Lining
Neutral
1,358
-
1,075
511
562
11.3
11.5
28.1
30.9
48.3
44.0
7.4
6.7
15.3
15.0
2.2
2.1
Setco Automotive
Neutral
43
-
578
741
837
13.0
13.0
15.2
17.0
2.9
2.5
0.5
0.4
15.8
16.3
1.2
1.1
Tata Motors
Neutral
456
-
131,678
300,209
338,549
8.9
8.4
42.7
54.3
10.7
8.4
1.7
1.4
15.6
17.2
0.6
0.5
TVS Motor
Neutral
572
-
27,151
13,390
15,948
6.9
7.1
12.8
16.5
44.8
34.5
11.1
8.8
26.3
27.2
2.1
1.7
Amara Raja Batteries
Accumulate
844
962
14,411
5,339
6,220
15.9
15.3
28.0
32.3
30.1
26.1
5.7
4.8
19.1
18.5
2.7
2.3
Exide Industries
Neutral
221
-
18,802
7,439
8,307
15.0
15.0
8.1
9.3
27.3
23.8
3.8
3.4
14.3
16.7
2.1
1.9
Apollo Tyres
Neutral
253
-
12,863
12,877
14,504
14.3
13.9
21.4
23.0
11.8
11.0
1.8
1.6
16.4
15.2
1.2
1.1
Ceat
Neutral
1,859
-
7,520
7,524
8,624
13.0
12.7
131.1
144.3
14.2
12.9
2.6
2.2
19.8
18.6
1.1
0.9
JK Tyres
Neutral
165
-
3,747
7,455
8,056
15.0
15.0
21.8
24.5
7.6
6.7
1.6
1.3
22.8
21.3
0.6
0.5
Swaraj Engines
Neutral
2,160
-
2,683
660
810
15.2
16.4
54.5
72.8
39.6
29.7
12.4
11.2
31.5
39.2
3.9
3.1
Subros
Neutral
247
-
1,480
1,488
1,681
11.7
11.9
6.4
7.2
38.6
34.4
4.1
3.7
10.8
11.4
1.2
1.1
Indag Rubber
Neutral
200
-
524
286
326
19.8
16.8
11.7
13.3
17.1
15.0
2.9
2.7
17.8
17.1
1.5
1.3
Capital Goods
ACE
Neutral
70
-
695
709
814
4.1
4.6
1.4
2.1
50.2
33.5
2.1
2.0
4.4
6.0
1.1
1.0
BEML
Neutral
1,525
-
6,351
3,451
4,055
6.3
9.2
31.4
57.9
48.6
26.3
2.9
2.7
6.3
10.9
2.0
1.7
Bharat Electronics
Neutral
174
-
38,798
8,137
9,169
16.8
17.2
58.7
62.5
3.0
2.8
0.5
0.4
44.6
46.3
3.7
3.4
Stock Watch
July 19, 2017
Company Name
Reco
CMP
Target
Mkt Cap
Sales ( Čcr )
OPM(%)
EPS (Č)
PER(x)
P/BV(x)
RoE(%)
EV/Sales(x)
(Č)
Price ( Č)
( Č cr )
FY17E
FY18E
FY17E
FY18E
FY17E
FY18E
FY17E
FY18E
FY17E
FY18E
FY17E
FY18E
FY17E
FY18E
Capital Goods
Voltas
Neutral
485
-
16,031
6,511
7,514
7.9
8.7
12.9
16.3
37.6
29.7
6.8
5.9
16.7
18.5
2.2
1.9
BGR Energy
Neutral
150
-
1,081
16,567
33,848
6.0
5.6
7.8
5.9
19.2
25.4
1.1
1.1
4.7
4.2
0.2
0.1
BHEL
Neutral
143
-
35,074
28,797
34,742
-
2.8
2.3
6.9
62.3
20.8
1.1
1.0
1.3
4.8
0.9
0.6
Blue Star
Buy
652
760
6,246
4,283
5,077
5.9
7.3
14.9
22.1
43.8
29.5
8.5
7.2
20.4
26.4
1.5
1.3
CG Power and Industrial
Neutral
85
-
5,321
5,777
6,120
5.9
7.0
3.3
4.5
25.7
18.9
1.1
1.1
4.4
5.9
0.9
0.8
Solutions
Greaves Cotton
Neutral
163
-
3,983
1,755
1,881
16.8
16.9
7.8
8.5
20.9
19.2
4.2
3.9
20.6
20.9
2.0
1.8
Inox Wind
Neutral
148
-
3,278
5,605
6,267
15.7
16.4
24.8
30.0
6.0
4.9
1.7
1.2
25.9
24.4
0.6
0.5
KEC International
Neutral
296
-
7,602
9,294
10,186
7.9
8.1
9.9
11.9
29.9
24.9
4.4
3.8
15.6
16.3
1.1
1.0
KEI Industries
Accumulate
234
258
1,824
2,633
3,001
10.4
10.0
12.7
13.0
18.4
18.0
4.0
3.3
21.4
18.2
0.9
0.8
Thermax
Neutral
897
-
10,690
5,421
5,940
7.3
7.3
25.7
30.2
34.9
29.7
4.2
3.9
12.2
13.1
1.9
1.7
VATech Wabag
Neutral
664
-
3,623
3,136
3,845
8.9
9.1
26.0
35.9
25.5
18.5
3.2
2.7
13.4
15.9
1.1
0.8
Cement
ACC
Neutral
1,760
-
33,047
11,225
13,172
13.2
16.9
44.5
75.5
39.6
23.3
3.7
3.5
11.2
14.2
2.9
2.5
Ambuja Cements
Neutral
265
-
52,709
9,350
10,979
18.2
22.5
5.8
9.5
45.8
27.9
3.9
3.5
10.2
12.5
5.6
4.8
India Cements
Neutral
209
-
6,448
4,364
4,997
18.5
19.2
7.9
11.3
26.5
18.5
1.9
1.9
8.0
8.5
2.2
2.0
JK Cement
Neutral
976
-
6,820
4,398
5,173
15.5
17.5
31.2
55.5
31.3
17.6
3.8
3.3
12.0
15.5
2.1
1.7
J K Lakshmi Cement
Neutral
466
-
5,478
2,913
3,412
14.5
19.5
7.5
22.5
62.1
20.7
3.8
3.2
12.5
18.0
2.5
2.1
Orient Cement
Neutral
158
-
3,228
2,114
2,558
18.5
20.5
8.1
11.3
19.5
13.9
2.9
2.4
9.0
14.0
2.1
1.7
UltraTech Cement
Neutral
4,315
-
118,458
25,768
30,385
21.0
23.5
111.0
160.0
38.9
27.0
5.0
4.3
13.5
15.8
4.7
3.9
Construction
ITNL
Neutral
94
-
3,094
8,946
10,017
31.0
31.6
8.1
9.1
11.6
10.3
0.4
0.4
4.2
5.0
3.7
3.4
KNR Constructions
Neutral
215
-
3,023
1,385
1,673
14.7
14.0
41.2
48.5
5.2
4.4
1.0
0.8
14.9
15.2
2.3
1.9
Larsen & Toubro
Buy
1,178
1,700
164,963
111,017
124,908
11.0
11.0
61.1
66.7
19.3
17.7
2.3
2.2
13.1
12.9
2.5
2.3
Gujarat Pipavav Port
Neutral
143
-
6,908
705
788
52.2
51.7
5.0
5.6
28.6
25.5
2.8
2.5
11.2
11.2
9.5
8.0
Nagarjuna Const.
Neutral
92
-
5,098
8,842
9,775
9.1
8.8
5.3
6.4
17.3
14.3
1.4
1.3
8.2
9.1
0.7
0.6
PNC Infratech
Neutral
145
-
3,720
2,350
2,904
13.1
13.2
9.0
8.8
16.1
16.5
0.6
0.5
15.9
13.9
1.7
1.4
Simplex Infra
Neutral
511
-
2,526
6,829
7,954
10.5
10.5
31.4
37.4
16.3
13.7
1.7
1.5
9.9
13.4
0.8
0.7
Power Mech Projects
Neutral
587
-
863
1,801
2,219
12.7
14.6
72.1
113.9
8.1
5.2
1.5
1.3
16.8
11.9
0.5
0.4
Sadbhav Engineering
Accumulate
283
298
4,849
3,598
4,140
10.3
10.6
9.0
11.9
31.4
23.8
3.3
2.9
9.9
11.9
1.6
1.4
NBCC
Neutral
209
-
18,851
7,428
9,549
7.9
8.6
8.2
11.0
25.5
19.0
1.3
1.0
28.2
28.7
2.3
1.7
MEP Infra
Neutral
129
-
2,094
1,877
1,943
30.6
29.8
3.0
4.2
42.9
30.7
20.8
14.0
0.6
0.6
2.5
2.3
Stock Watch
July 19, 2017
Company Name
Reco
CMP
Target
Mkt Cap
Sales ( Čcr )
OPM(%)
EPS (Č)
PER(x)
P/BV(x)
RoE(%)
EV/Sales(x)
(Č)
Price ( Č)
( Č cr )
FY17E
FY18E
FY17E
FY18E
FY17E
FY18E
FY17E
FY18E
FY17E
FY18E
FY17E
FY18E
FY17E
FY18E
Construction
SIPL
Neutral
106
-
3,734
1,036
1,252
65.5
66.2
(8.4)
(5.6)
4.0
4.5
(22.8)
(15.9)
11.8
9.8
Engineers India
Neutral
157
-
10,583
1,725
1,935
16.0
19.1
11.4
13.9
13.8
11.3
1.9
1.8
13.4
15.3
5.1
4.5
Financials
Axis Bank
Accumulate
517
580
123,934
46,932
53,575
3.5
3.4
32.4
44.6
16.0
11.6
2.1
1.8
13.6
16.5
-
-
Bank of Baroda
Neutral
164
-
37,696
19,980
23,178
1.8
1.8
11.5
17.3
14.2
9.5
1.6
1.3
8.3
10.1
-
-
Canara Bank
Neutral
369
-
22,031
15,225
16,836
1.8
1.8
14.5
28.0
25.4
13.2
1.8
1.4
5.8
8.5
-
-
Can Fin Homes
Neutral
3,161
-
8,415
420
526
3.5
3.5
86.5
107.8
36.6
29.3
7.9
6.4
23.6
24.1
-
-
Cholamandalam Inv. &
Accumulate
1,119
1,230
17,490
2,012
2,317
6.3
6.3
42.7
53.6
26.2
20.9
4.1
3.6
16.9
18.3
-
-
Fin. Co.
Dewan Housing Finance Accumulate
459
520
14,401
2,225
2,688
2.9
2.9
29.7
34.6
15.5
13.3
2.5
1.6
16.1
14.8
-
-
Equitas Holdings
Buy
167
235
5,662
939
1,281
11.7
11.5
5.8
8.2
28.8
20.4
2.5
2.2
10.9
11.5
-
-
Federal Bank
Accumulate
113
125
22,014
8,259
8,995
3.0
3.0
4.3
5.6
26.4
20.2
2.2
2.1
8.5
10.1
-
-
HDFC
Neutral
1,653
-
263,329
11,475
13,450
3.4
3.4
45.3
52.5
36.5
31.5
7.0
6.2
20.2
20.5
-
-
HDFC Bank
Neutral
1,683
-
433,069
46,097
55,433
4.5
4.5
58.4
68.0
28.8
24.7
5.1
4.2
18.8
18.6
-
-
ICICI Bank
Neutral
303
-
194,055
42,800
44,686
3.1
3.3
18.0
21.9
16.8
13.8
2.3
2.1
11.1
12.3
-
-
Karur Vysya Bank
Buy
134
160
8,119
5,640
6,030
3.3
3.2
8.9
10.0
15.1
13.4
1.6
1.5
11.2
11.4
-
-
Lakshmi Vilas Bank
Neutral
201
-
3,860
3,339
3,799
2.7
2.8
11.0
14.0
18.3
14.4
1.9
1.7
11.2
12.7
-
-
LIC Housing Finance
Neutral
743
-
37,504
3,712
4,293
2.6
2.5
39.0
46.0
19.1
16.2
3.6
3.1
19.9
20.1
-
-
Punjab Natl.Bank
Neutral
155
-
32,962
23,532
23,595
2.3
2.4
6.8
12.6
22.8
12.3
3.5
2.5
3.3
6.5
-
-
RBL Bank
Neutral
522
-
19,641
1,783
2,309
2.6
2.6
12.7
16.4
41.1
31.8
4.5
4.0
12.8
13.3
-
-
Repco Home Finance
Neutral
799
-
4,996
388
457
4.5
4.2
30.0
38.0
26.6
21.0
4.4
3.7
18.0
19.2
-
-
South Ind.Bank
Neutral
28
-
5,113
6,435
7,578
2.5
2.5
2.7
3.1
10.5
9.2
1.4
1.1
10.1
11.2
-
-
St Bk of India
Neutral
290
-
250,718
88,650
98,335
2.6
2.6
13.5
18.8
21.5
15.5
2.1
1.8
7.0
8.5
-
-
Union Bank
Neutral
156
-
10,707
13,450
14,925
2.3
2.3
25.5
34.5
6.1
4.5
0.9
0.8
7.5
10.2
-
-
Yes Bank
Neutral
1,552
-
71,019
8,978
11,281
3.3
3.4
74.0
90.0
21.0
17.3
4.0
3.4
17.0
17.2
-
-
FMCG
Akzo Nobel India
Neutral
1,790
-
8,584
2,955
3,309
13.3
13.7
57.2
69.3
31.3
25.8
10.2
8.6
32.7
33.3
2.7
2.4
Asian Paints
Neutral
1,146
-
109,924
17,128
18,978
16.8
16.4
19.1
20.7
60.0
55.4
20.9
19.7
34.8
35.5
6.3
5.7
Britannia
Neutral
3,743
-
44,942
9,594
11,011
14.6
14.9
80.3
94.0
46.6
39.8
19.2
14.8
41.2
-
4.5
3.9
Colgate
Neutral
1,073
-
29,181
4,605
5,149
23.4
23.4
23.8
26.9
45.1
39.9
25.0
19.5
64.8
66.8
6.3
5.6
Dabur India
Neutral
301
-
52,969
8,315
9,405
19.8
20.7
8.1
9.2
37.1
32.7
10.3
8.6
31.6
31.0
6.0
5.3
GlaxoSmith Con*
Neutral
5,429
-
22,831
4,350
4,823
21.2
21.4
179.2
196.5
30.3
27.6
8.0
6.8
27.1
26.8
4.6
4.1
Stock Watch
July 19, 2017
Company Name
Reco
CMP
Target
Mkt Cap
Sales ( Čcr )
OPM(%)
EPS (Č)
PER(x)
P/BV(x)
RoE(%)
EV/Sales(x)
(Č)
Price ( Č)
( Č cr )
FY17E FY18E
FY17E
FY18E
FY17E
FY18E
FY17E
FY18E
FY17E
FY18E
FY17E
FY18E
FY17E
FY18E
FMCG
Godrej Consumer
Neutral
956
-
65,133
10,235
11,428
18.4
18.6
41.1
44.2
23.3
21.6
5.2
4.4
24.9
24.8
6.4
5.7
HUL
Neutral
1,158
-
250,688
35,252
38,495
17.8
17.8
20.7
22.4
56.1
51.7
53.6
46.0
95.6
88.9
7.0
6.4
ITC
Neutral
285
-
346,125
40,059
44,439
38.3
39.2
9.0
10.1
31.7
28.1
8.8
7.7
27.8
27.5
8.1
7.3
Marico
Neutral
329
-
42,450
6,430
7,349
18.8
19.5
6.4
7.7
51.4
42.7
15.5
13.1
33.2
32.5
6.4
5.6
Nestle*
Neutral
6,862
-
66,160
10,073
11,807
20.7
21.5
124.8
154.2
55.0
44.5
22.6
20.3
34.8
36.7
6.4
5.4
Tata Global
Neutral
174
-
10,966
8,675
9,088
9.8
9.8
7.4
8.2
23.5
21.2
1.9
1.8
7.9
8.1
1.2
1.1
Procter & Gamble
Neutral
7,985
-
25,920
2,939
3,342
23.2
23.0
146.2
163.7
54.6
48.8
13.8
11.5
25.3
23.5
8.4
7.3
Hygiene
IT
HCL Tech^
Buy
881
1,014
125,725
46,723
52,342
22.1
20.9
60.0
62.8
14.7
14.0
3.7
3.2
25.3
22.4
2.4
2.1
Infosys
Buy
985
1,179
226,341
68,484
73,963
26.0
26.0
63.0
64.0
15.6
15.4
3.3
3.0
20.8
19.7
3.0
2.6
TCS
Accumulate
2,405
2,651
473,937
117,966
127,403
27.5
27.6
134.3
144.5
17.9
16.7
5.3
5.0
29.8
29.7
3.7
3.4
Tech Mahindra
Buy
391
533
38,150
29,141
31,051
14.4
15.0
32.3
35.6
12.1
11.0
2.1
1.9
17.1
17.0
1.2
1.0
Wipro
Neutral
269
-
130,736
55,421
58,536
20.3
20.3
35.1
36.5
7.7
7.4
1.3
1.1
19.2
14.6
1.8
1.5
Media
D B Corp
Neutral
374
-
6,884
2,297
2,590
27.4
28.2
21.0
23.4
17.8
16.0
4.2
3.6
23.7
23.1
2.8
2.4
HT Media
Neutral
89
-
2,071
2,693
2,991
12.6
12.9
7.9
9.0
11.3
9.9
1.0
0.9
7.8
8.3
0.4
0.2
Jagran Prakashan
Buy
172
225
5,610
2,283
2,555
28.0
28.0
10.6
12.3
16.1
14.0
3.5
3.0
21.4
21.4
2.5
2.2
Sun TV Network
Neutral
827
-
32,587
2,850
3,265
70.1
71.0
26.2
30.4
31.6
27.2
8.1
7.1
24.3
25.6
11.0
9.5
Hindustan Media
Neutral
276
-
2,027
1,016
1,138
24.3
25.2
27.3
30.1
10.1
9.2
1.9
1.7
16.2
15.8
1.3
1.1
Ventures
TV Today Network
Buy
253
344
1,508
608
667
21.5
22.3
15.7
19.2
16.1
13.1
2.5
2.1
16.1
16.0
2.1
1.8
Metals & Mining
Coal India
Neutral
248
-
154,223
84,638
94,297
21.4
22.3
24.5
27.1
10.1
9.2
4.2
4.0
42.6
46.0
1.3
1.2
Hind. Zinc
Neutral
278
-
117,295
14,252
18,465
55.9
48.3
15.8
21.5
17.6
12.9
2.9
2.5
17.0
20.7
8.2
6.4
Hindalco
Neutral
207
-
46,519
107,899
112,095
7.4
8.2
9.2
13.0
22.5
16.0
1.1
1.0
4.8
6.6
1.0
0.9
JSW Steel
Neutral
216
-
52,224
53,201
58,779
16.1
16.2
130.6
153.7
1.7
1.4
0.2
0.2
14.0
14.4
1.7
1.5
NMDC
Neutral
120
-
37,808
6,643
7,284
44.4
47.7
7.1
7.7
16.8
15.5
1.5
1.4
8.8
9.2
3.5
3.1
SAIL
Neutral
63
-
25,896
47,528
53,738
(0.7)
2.1
(1.9)
2.6
24.1
0.7
0.7
(1.6)
3.9
1.4
1.3
Vedanta
Neutral
268
-
99,751
71,744
81,944
19.2
21.7
13.4
20.1
20.0
13.4
1.7
1.5
8.4
11.3
1.8
1.4
Tata Steel
Neutral
563
-
54,660
121,374
121,856
7.2
8.4
18.6
34.3
30.3
16.4
1.9
1.7
6.1
10.1
1.1
1.1
Oil & Gas
GAIL
Neutral
378
-
63,931
56,220
65,198
9.3
10.1
27.1
33.3
14.0
11.4
1.3
1.2
9.3
10.7
1.3
1.1
ONGC
Neutral
162
-
207,578
137,222
152,563
15.0
21.8
19.5
24.1
8.3
6.7
0.7
0.7
8.5
10.1
1.8
1.6
Indian Oil Corp
Neutral
372
-
180,713
373,359
428,656
5.9
5.5
54.0
59.3
6.9
6.3
1.1
1.0
16.0
15.6
0.6
0.5
Stock Watch
July 19, 2017
Company Name
Reco
CMP
Target
Mkt Cap
Sales ( Čcr )
OPM(%)
EPS (Č)
PER(x)
P/BV(x)
RoE(%)
EV/Sales(x)
(Č)
Price ( Č)
( Č cr )
FY17E FY18E
FY17E
FY18E
FY17E
FY18E
FY17E
FY18E
FY17E
FY18E
FY17E
FY18E
FY17E
FY18E
Oil & Gas
Reliance Industries
Neutral
1,520
-
494,231
301,963
358,039
12.1
12.6
87.7
101.7
17.3
14.9
1.8
1.6
10.7
11.3
2.1
1.8
Pharmaceuticals
Alembic Pharma
Buy
554
648
10,435
3,101
3,966
19.7
20.5
21.4
25.5
25.9
21.7
5.5
4.5
23.0
22.8
3.3
2.5
Alkem Laboratories Ltd
Buy
1,736
2,161
20,756
5,853
6,901
17.1
18.4
74.6
85.0
23.3
20.4
4.9
4.1
21.1
20.2
3.5
3.0
Aurobindo Pharma
Accumulate
734
823
42,989
14,845
17,086
21.5
22.1
39.4
44.7
18.6
16.4
4.6
3.6
27.6
24.7
3.1
2.6
Aventis*
Neutral
4,201
-
9,676
2,206
2,508
16.6
16.8
128.9
139.9
32.6
30.0
5.6
4.4
21.6
23.5
4.2
3.5
Cadila Healthcare
Reduce
525
450
53,741
9,220
11,584
18.4
20.3
14.5
18.7
36.2
28.1
7.7
6.3
23.5
24.6
6.2
4.7
Cipla
Sell
559
461
45,007
14,281
16,619
15.4
16.2
12.5
19.7
44.8
28.4
3.6
3.2
8.4
12.0
3.3
2.8
Dr Reddy's
Neutral
2,716
-
45,013
14,081
15,937
16.1
18.6
72.6
105.9
37.4
25.6
3.7
3.3
9.6
13.6
3.4
3.0
Dishman Pharma
Sell
143
1,718
1,890
22.7
22.8
9.5
11.3
10.1
10.9
3.3
2.9
GSK Pharma*
Neutral
2,523
-
21,374
2,927
3,290
11.8
16.2
34.4
49.6
73.4
50.9
10.7
11.1
13.9
21.3
7.1
6.4
Indoco Remedies
Sell
205
153
1,888
1,067
1,154
12.1
14.9
8.4
11.3
24.4
18.1
2.9
2.6
12.6
15.0
2.0
1.8
Ipca labs
Buy
481
620
6,067
3,211
3,593
13.9
14.5
15.4
19.4
31.2
24.8
2.5
2.3
8.2
9.5
2.0
1.8
Lupin
Buy
1,156
1,526
52,206
17,120
18,657
24.1
24.1
56.9
61.1
20.3
18.9
3.9
3.2
20.7
18.6
3.3
2.7
Natco Pharma
Accumulate
975
1,060
16,993
2,065
1,988
33.1
33.7
27.9
25.7
35.0
37.9
10.2
8.7
29.2
22.9
8.3
8.4
Sun Pharma
Buy
578
712
138,688
30,264
32,899
29.0
26.9
32.7
31.6
17.7
18.3
3.8
3.2
22.2
18.7
4.3
3.9
Power
Tata Power
Neutral
82
-
22,301
36,916
39,557
17.4
27.1
5.1
6.3
16.2
13.1
1.4
1.3
9.0
10.3
1.6
1.5
NTPC
Neutral
167
-
137,740
86,605
95,545
17.5
20.8
11.8
13.4
14.2
12.5
1.4
1.3
10.5
11.1
2.9
2.9
Power Grid
Neutral
215
-
112,688
25,315
29,193
88.2
88.7
14.2
17.2
15.2
12.6
2.3
2.0
15.2
16.1
9.1
8.2
Real Estate
Prestige Estate
Neutral
250
-
9,388
4,707
5,105
25.2
26.0
10.3
13.0
24.3
19.3
2.0
1.8
10.3
10.2
3.2
2.8
MLIFE
Buy
436
522
2,239
1,152
1,300
22.7
24.6
29.9
35.8
14.6
12.2
1.1
1.0
7.6
8.6
2.7
2.2
Telecom
Bharti Airtel
Neutral
408
-
163,194
105,086
114,808
34.5
34.7
12.2
16.4
33.5
24.9
2.3
2.1
6.8
8.4
2.5
2.2
Idea Cellular
Neutral
87
-
31,427
40,133
43,731
37.2
37.1
6.4
6.5
13.6
13.4
1.1
1.1
8.2
7.6
1.8
1.5
zOthers
Abbott India
Neutral
4,472
-
9,503
3,153
3,583
14.1
14.4
152.2
182.7
29.4
24.5
144.3
123.2
25.6
26.1
2.7
2.3
Asian Granito
Accumulate
422
480
1,269
1,066
1,169
11.6
12.5
13.0
16.0
32.5
26.4
3.2
2.8
9.5
10.7
1.5
1.3
Bajaj Electricals
Buy
333
395
3,379
4,801
5,351
5.7
6.2
10.4
13.7
32.0
24.4
4.0
3.5
12.4
14.5
0.7
0.6
Banco Products (India)
Neutral
234
-
1,670
1,353
1,471
12.3
12.4
14.5
16.3
16.1
14.3
22.2
20.0
14.5
14.6
1.2
126.4
Coffee Day Enterprises
Neutral
247
-
5,078
2,964
3,260
20.5
21.2
4.7
8.0
-
30.8
2.9
2.6
5.5
8.5
2.1
1.9
Ltd
Competent Automobiles Neutral
187
-
120
1,137
1,256
3.1
2.7
28.0
23.6
6.7
7.9
36.0
32.6
14.3
11.5
0.1
0.1
Elecon Engineering
Neutral
60
-
675
1,482
1,660
13.7
14.5
3.9
5.8
15.4
10.4
3.6
3.3
7.8
10.9
0.8
0.7
Stock Watch
July 19, 2017
Company Name
Reco
CMP
Target
Mkt Cap
Sales ( Čcr )
OPM(%)
EPS (Č)
PER(x)
P/BV(x)
RoE(%)
EV/Sales(x)
(Č)
Price ( Č)
( Č cr )
FY17E
FY18E
FY17E
FY18E
FY17E
FY18E
FY17E
FY18E
FY17E
FY18E
FY17E
FY18E
FY17E
FY18E
zOthers
Finolex Cables
Neutral
502
-
7,678
2,883
3,115
12.0
12.1
14.2
18.6
35.4
27.0
18.8
16.4
15.8
14.6
2.4
2.1
Garware Wall Ropes
Neutral
900
-
1,970
863
928
15.1
15.2
36.4
39.4
24.7
22.9
4.5
3.8
17.5
15.9
2.2
2.0
Goodyear India*
Neutral
906
-
2,089
1,598
1,704
10.4
10.2
49.4
52.6
18.3
17.2
84.6
74.2
18.2
17.0
1.0
141.9
Hitachi
Neutral
1,980
-
5,384
2,081
2,433
8.8
8.9
33.4
39.9
59.3
49.6
47.8
39.9
22.1
21.4
2.6
2.2
HSIL
Neutral
401
-
2,898
2,384
2,515
15.8
16.3
15.3
19.4
26.2
20.7
26.0
22.4
7.8
9.3
1.4
1.3
Interglobe Aviation
Neutral
1,278
-
46,229
21,122
26,005
14.5
27.6
110.7
132.1
11.6
9.7
69.1
49.4
168.5
201.1
2.2
1.7
Jyothy Laboratories
Neutral
369
-
6,709
1,440
2,052
11.5
13.0
8.5
10.0
43.4
36.9
10.5
9.7
18.6
19.3
4.9
3.4
Kirloskar Engines India
Neutral
395
-
5,712
2,554
2,800
9.9
10.0
10.5
12.1
37.6
32.6
15.7
14.9
10.7
11.7
1.9
1.7
Ltd
Linc Pen & Plastics
Neutral
278
-
411
382
420
9.3
9.5
13.5
15.7
20.6
17.7
3.5
3.1
17.1
17.3
1.1
1.0
M M Forgings
Neutral
641
-
774
546
608
20.4
20.7
41.3
48.7
15.5
13.2
87.8
77.7
16.6
17.0
1.3
1.1
Manpasand Bever.
Neutral
750
-
4,291
836
1,087
19.6
19.4
16.9
23.8
44.4
31.5
5.3
4.7
12.0
14.8
4.9
3.7
Mirza International
Neutral
156
-
1,880
963
1,069
17.2
18.0
6.1
7.5
25.5
20.8
3.9
3.3
15.0
15.7
2.2
1.9
MT Educare
Neutral
73
-
291
366
417
17.7
18.2
9.4
10.8
7.8
6.8
1.7
1.5
22.2
22.3
0.7
0.6
Narayana Hrudaya
Neutral
307
-
6,267
1,873
2,166
11.5
11.7
2.6
4.0
115.9
77.4
7.1
6.4
6.1
8.3
3.4
3.0
Navkar Corporation
Buy
201
265
2,868
347
371
43.2
37.3
6.7
6.0
30.2
33.5
2.1
1.9
6.2
10.6
9.4
8.8
Navneet Education
Neutral
178
-
4,162
1,062
1,147
24.0
24.0
6.1
6.6
29.3
26.9
6.0
5.3
20.6
19.8
4.0
3.7
Nilkamal
Neutral
1,920
-
2,866
1,995
2,165
10.7
10.4
69.8
80.6
27.5
23.8
109.7
95.3
16.6
16.5
1.4
1.3
Page Industries
Neutral
16,825
-
18,767
2,450
3,124
20.1
17.6
299.0
310.0
56.3
54.3
374.7
286.1
47.1
87.5
7.7
6.1
Parag Milk Foods
Neutral
235
-
1,980
1,919
2,231
9.3
9.6
9.5
12.9
24.9
18.2
3.9
3.2
15.5
17.5
1.2
1.0
Quick Heal
Neutral
225
-
1,579
408
495
27.3
27.0
7.7
8.8
29.1
25.6
2.7
2.7
9.3
10.6
3.0
2.5
Radico Khaitan
Buy
126
147
1,672
1,667
1,824
13.0
13.2
6.7
8.2
18.9
15.4
1.7
1.6
9.0
10.2
1.4
1.2
Relaxo Footwears
Neutral
498
-
5,985
2,085
2,469
9.2
8.2
7.6
8.0
65.9
62.7
25.6
21.8
17.9
18.8
3.0
2.5
S H Kelkar & Co.
Neutral
261
-
3,781
1,036
1,160
15.1
15.0
6.1
7.2
42.8
36.4
4.6
4.2
10.7
11.5
3.5
3.1
Siyaram Silk Mills
Neutral
2,464
-
2,310
1,574
1,769
12.5
12.7
97.1
113.1
25.4
21.8
3.9
3.4
15.4
15.5
1.7
1.5
Styrolution ABS India*
Neutral
1,005
-
1,768
1,440
1,537
9.2
9.0
40.6
42.6
24.8
23.6
63.2
57.5
12.3
11.6
1.2
1.1
Surya Roshni
Neutral
278
-
1,220
3,342
3,625
7.8
7.5
17.3
19.8
16.1
14.1
30.6
24.5
10.5
10.8
0.6
0.6
Team Lease Serv.
Neutral
1,486
-
2,540
3,229
4,001
1.5
1.8
22.8
32.8
65.3
45.2
7.0
6.1
10.7
13.4
0.7
0.5
The Byke Hospitality
Neutral
188
-
755
287
384
20.5
20.5
7.6
10.7
24.8
17.6
5.2
4.2
20.7
23.5
2.6
2.0
Transport Corporation of
Neutral
327
-
2,503
2,671
2,911
8.5
8.8
13.9
15.7
23.6
20.9
3.2
2.9
13.7
13.8
1.0
1.0
India
Stock Watch
July 19, 2017
Company Name
Reco
CMP
Target Mkt Cap
Sales ( Čcr )
OPM(%)
EPS (Č)
PER(x)
P/BV(x)
RoE(%)
EV/Sales(x)
(Č)
Price ( Č)
( Č cr )
FY17E FY18E FY17E FY18E FY17E FY18E FY17E FY18E FY17E FY18E FY17E FY18E FY17E FY18E
zOthers
TVS Srichakra
Neutral
3,768
-
2,885
2,304
2,614
13.7
13.8
231.1
266.6
16.3
14.1
423.4
333.4
33.9
29.3
1.3
1.1
UFO Moviez
Neutral
392
-
1,083
619
685
33.2
33.4
30.0
34.9
13.1
11.2
1.8
1.6
13.8
13.9
1.5
1.1
Visaka Industries
Neutral
505
-
802
1,051
1,138
10.3
10.4
21.0
23.1
24.0
21.8
64.8
60.7
9.0
9.2
1.0
1.0
VRL Logistics
Neutral
319
-
2,906
1,902
2,119
16.7
16.6
14.6
16.8
21.9
18.9
4.8
4.2
21.9
22.2
1.6
1.4
VIP Industries
Buy
179
218
2,526
1,270
1,450
10.4
10.4
5.6
6.5
31.9
27.5
6.6
5.8
20.7
21.1
2.0
1.7
Navin Fluorine
Accumulate
3,292
3,650
3,244
789
945
21.1
22.4
120.1
143.4
27.4
23.0
4.4
3.8
17.8
18.5
4.0
3.3
Source: Company, Angel Research; Note: *December year end; #September year end; &October year end; Price as on July 18, 2017
Market Outlook
July 19, 2017
Research Team Tel: 022 - 39357800
DISCLAIMER
Angel Broking Private Limited (hereinafter referred to as “Angel”) is a registered Member of National Stock Exchange of India
Limited,Bombay Stock Exchange Limited and Metropolitan Stock Exchange Limited. It is also registered as a Depository Participant with
CDSL and Portfolio Manager with SEBI. It also has registration with AMFI as a Mutual Fund Distributor. Angel Broking Private Limited is a
registered entity with SEBI for Research Analyst in terms of SEBI (Research Analyst) Regulations, 2014 vide registration number
INH000000164. Angel or its associates has not been debarred/ suspended by SEBI or any other regulatory authority for accessing
/dealing in securities Market. Angel or its associates/analyst has not received any compensation / managed or
co-managed public offering of securities of the company covered by Analyst during the past twelve months.
This document is solely for the personal information of the recipient, and must not be singularly used as the basis of any investment
decision. Nothing in this document should be construed as investment or financial advice. Each recipient of this document should make
such investigations as they deem necessary to arrive at an independent evaluation of an investment in the securities of the companies
referred to in this document (including the merits and risks involved), and should consult their own advisors to determine the merits and
risks of such an investment.
Reports based on technical and derivative analysis center on studying charts of a stock's price movement, outstanding positions and
trading volume, as opposed to focusing on a company's fundamentals and, as such, may not match with a report on a company's
fundamentals. Investors are advised to refer the Fundamental and Technical Research Reports available on our website to evaluate the
contrary view, if any.
The information in this document has been printed on the basis of publicly available information, internal data and other reliable
sources believed to be true, but we do not represent that it is accurate or complete and it should not be relied on as such, as this
document is for general guidance only. Angel Broking Pvt. Limited or any of its affiliates/ group companies shall not be in any way
responsible for any loss or damage that may arise to any person from any inadvertent error in the information contained in this report.
Angel Broking Pvt. Limited has not independently verified all the information contained within this document. Accordingly, we cannot
testify, nor make any representation or warranty, express or implied, to the accuracy, contents or data contained within this document.
While Angel Broking Pvt. Limited endeavors to update on a reasonable basis the information discussed in this material, there may be
regulatory, compliance, or other reasons that prevent us from doing so.
This document is being supplied to you solely for your information, and its contents, information or data may not be reproduced,
redistributed or passed on, directly or indirectly.
Neither Angel Broking Pvt. Limited, nor its directors, employees or affiliates shall be liable for any loss or damage that may arise from
or in connection with the use of this information.